Monitor Your System With gkrellm
by Pete Kelly (critter)
A driver has lots of information available to enable him to monitor things like the engine speed and temperature, or the amount of fuel remaining and distance traveled. When something out of the ordinary happens, he is alerted to the fact by a light on the dashboard, or something similar. Without this information, he risks damaging the engine or being stranded with no fuel.
A computer can supply a lot of information that is just as important for its continued and smooth operation. There are a lot of tools available to gather and display this information. One such tool is gkrellm, an unobtrusive little application that sits on your desktop providing continuously updated information about whatever you want. It uses very little of the system's resources, is easy to configure and is in the PCLinuxOS repositories.
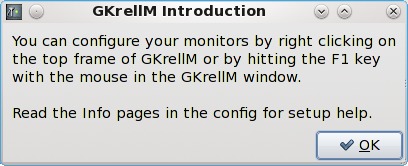
On first run, the default setup is placed on the desktop and a one-time only pop up window explains how to enter the configuration dialog.
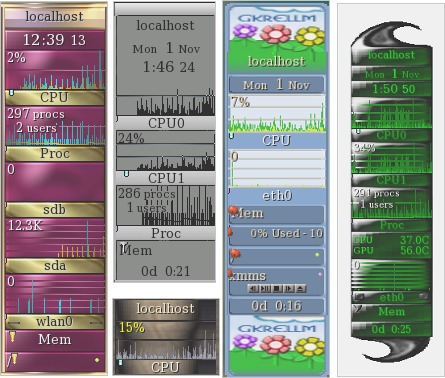
Gkrellm appears as a set of stacked monitors, one on top of the other, and this stack can be as tall or as short as you like. The default theme is rather uninspiring, at least to my eyes. Fortunately, a package named gkrellm-themes is in the PCLinuxOS repositories which provides almost 200 alternatives to be as discrete, funky or practical as you want. You can, of course, always make your own themes if you are the creative type. More information is available at the gkrellm-website and here. I prefer a theme that is easy to read, such as photon, but you may prefer a theme that blends in with your desktop.
Default

Photon

To start configuring gkrellm, right click on the top frame of gkrellm and you will be greeted by a relatively large dialog that enables you to do all of your changes in one place. On the left is a list of sections and on the right a tabbed interface with lots of buttons to check, boxes to enter information into and other stuff to change as you will. The last tab on each page is named info, and this is where you find out which buttons to check and what to type into the boxes. All of this is, for the most part, fairly intuitive. But one or two things might need further explanation, so I will run through a few of them to get you started.
The first section, General, sets the properties of the gkrellm window, not the monitors. If you want the application to appear on all of the virtual desktops, you check 'set sticky state'. As you probably don't want it cluttering up your panel or pager, you might want to also check those relative boxes. Anything else here? Well I always check 'remember screen position…' so that I know where to look.
Why this is important can be shown this way: drag gkrellm to one of the screen edges and middle click on one of the vertical bars. It slides shut to just a few pixels wide. Now the panel is not so obvious, but it is still monitoring your system, and any alarms or warnings that you have set will still be triggered (more on that later). If middle click doesn't work for you or you don't have a middle button, just click the left and right buttons simultaneously.
Now you see it
And now you don't

The next section, Builtins, is where most of the action takes place. Open it up by clicking on the little triangle at the side of the word builtins. In the default layout, the first builtin is Sensors, and there you will find all of the sensors that the system has recognized. Check the ones that you want to monitor, and if you want to change the label for that sensor, then just click on the label and type in your preference. When you click on a sensor that you have enabled, the Alerts button becomes active. Clicking on the button brings up a new dialog. As an example, if you have highlighted the CPU temperature sensor and then clicked alerts, you can set a warning when the CPU temperature is getting too high. After a couple of days using gkrellm, you'll know what is the norm. My CPU typically operates around 40°C, so I set a warning of 70°C and an alarm at 80°C. What happens then is that the sensors flash amber for a warning and red for an alarm (it looks a bit like red and yellow jelly beans).

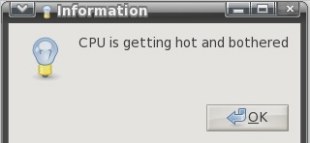
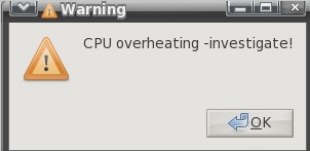
This is fine, but what if you have closed gkrellm to minimum width with a middle click on the vertical bar? You can't see the jelly beans and your CPU is cooking. This is where the rest of the alerts dialog helps. You can have some visual or audio event triggered once or repeatedly. I use the following two commands in those boxes:
zenity --info --text="CPU is getting hot and bothered"
zenity --warning --text="CPU overheating — Investigate!"
I then will then get a nice little messagebox pop up on the screen when disaster is about to strike. You can check that it works by setting the trigger value to just above its current value, and then run a bunch of heavy duty apps to trigger the alert.
The next builtin is the clock, which manages both the clock and the calendar. Here you can choose to display either, neither or both, and change the display to set an hourly and/or quarter-hourly chime. You can also set a launch command. This is a feature common to many of the builtins. Click on the monitor to launch your chosen command, e.g., enter the name of your organizer application in the calendar command box to launch the application with a single click on the calendar.
Next up is CPU. There isn't much to do here, but if you have a multi-core processor or multiple processors, you can display them separately, as a composite or even have both types of display. This allows you to see at a glance just how much work your processor has to do. Does it seem right or is there something eating up CPU cycles?
Proc is probably of more use on servers, or for system administrators, but it can give the stand-alone user an idea of system load.
Note: If you notice that there is more than one user declared on the proc monitor, don't panic. Your system isn't being hacked. You probably have a terminal open somewhere which counts as an extra login.
The Disk builtin allows you to monitor data throughput for either read, write or both, on each disk and/or partition on the system. If you use solid state drives, then you should use this, as those drives currently have a limited number of write cycles and an uncaring process. Repeatedly writing small amounts of data can shorten the life of the drive.
Internet allows you to monitor port accesses, which you might well be interested in if you are running a web server or ftp server, or perhaps you would like to know if you are receiving unwanted attention. Ports can be monitored individually or as a range.
Net shows network activity and is particularly useful if you are on a dial-up or monitored bandwidth connection. There is an option to enable a timer button with optional start and stop commands so that you can see at a glance your time on line. The chart shows current throughput and speed, and hovering the mouse over the chart brings up a tiny button. Clicking this brings up a statistics dialog showing daily, weekly and monthly statistics for received, transmitted and total data for the time period. This is a boon for those on restricted bandwidth, But be aware that if you use other computers, or if you dual/multi-boot, these totals apply only for the operating system on this machine.
Memory offers monitoring of both RAM and swap memory, allows you to set up alerts and to launch a command when clicking on the monitor. There is an option to 'show three memory krells.' A krell is the small left-right moving pointer, one for each of the reported memory values, but in most cases, with current amounts of installed RAM, these values are so close together that this option is almost useless.
File System is a really useful builtin, but requires a little bit of work setting things up in order to get the most out of it. Here you add partitions or storage devices that you want to monitor and control. For each device, you need to add a label for the monitor and a mount point. You then get a meter with a capacity krell (slider), and clicking on the meter toggles a scrolling display of usage, free space etc.
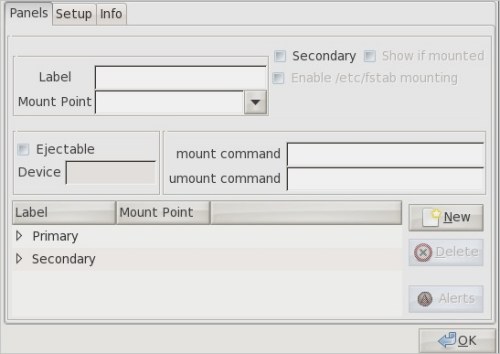
In the screen-shot, we have 1 box for the label and 1 for the mount point. Dropping down the mount point box will give a list of those file systems that it knows about, and you can select one from there. Give it any unique label you fancy. At the bottom of the dialog are the beginnings of two lists of devices waiting to be populated. A device can be primary or secondary. A primary device is one that is always available, like the root directory of the system and the home directory. A secondary device is one that gets mounted as required and can be hidden from view when not required, such as external drives and CDROMs.
Select a partition to monitor and label it, and decide if this is to be a primary or secondary device. If secondary, then click the secondary button. If you want it to be automatically shown when mounted, then click that button also, then click new. This will create the basic monitor for that device.
The system knows how to mount a device if it is listed in a file in the /etc directory named fstab, which you need administrator privileges to edit, but not to view. Each line of this file describes the information to mount one device. It contains such information as the device name as known by the system, the mount point where the contents can be found when mounted, the type of file system on the device and any special options required to mount it. The options part is quite often 'defaults'. This is fine, but has the disadvantage of only allowing root to do the mounting and unmounting.
If you have a partition where you keep all your data that you don't want in your home folder and mounted at /mnt/data, then it would be good if you could mount and unmount it at will. If it is unmounted, you can't accidentally delete or overwrite valuable files.
To be able to do this, edit the /etc/fstab file as root (make a backup copy somewhere), and locate the line for the partition that you want to control. Change the word defaults to users,noauto,defaults — no spaces and separated by commas. What this does is to allow ordinary users to mount and unmount the file system, not automatically mount the file system at boot time and leave the rest of the options at their default settings. Save the file. If you are not sure how to do this without fear of making the system unusable, then please get some more knowledgeable assistance.
Go back to the file system configuration dialog and check the 'Enable /etc/fstab mounting' box. The 'New' button is now labeled 'Apply.' Click on that. You will now have a button on the right side of the 'data' monitor which you can use to mount and unmount the device. If the device is unmounted and not visible, moving the mouse wheel while over one of the visible devices will show hidden devices. Alternatively, move the mouse to the topmost file system monitor, and a button will appear which can be used to show or hide unmounted devices. You can also provide mount and umount commands in the boxes provided for devices not listed in fstab. But you must, of course, have permissions to do this, perhaps by editing the sudoers file. But that is another tutorial for another day.
Another nice touch is to be able to control ejectable media. Although most systems nowadays can automatically detect and mount removable media, such as CDROMs and thumb drives, it is nice to be able to keep a measure of control, particularly for devices such as CDROMs, so that you know exactly when and where they are mounted. A line like this in your fstab file will allow you to mount the CDROM (the first CDROM on the system, if you have more than one) in the folder /media/cdrom, providing of course that the folder exists:
/dev/sr0 /media/cdrom iso9660 users,noauto,ro, 0 0
If you now fill out the dialog like this:
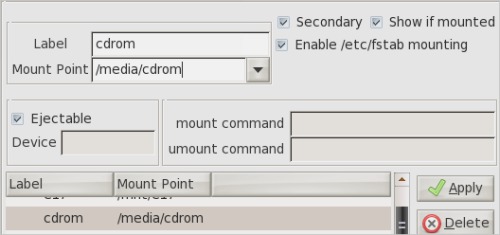
You will now be able to mount and unmount your cdrom drive at will. And with the Ejectable box ticked when the drive is unmounted, moving the mouse over the mount/unmount button will cause another small button to appear, which you can click to open the tray. If the drive is empty, then clicking the mount/unmount button will open the tray.
The order of the drives in the list can be changed by simply click-dragging them to a new position.
It is possible to use the file system builtin to control the mounting of both nfs and smb network shares, but you must remember to umount the share before powering down the remote machine, or otherwise breaking the network connection. If you don't, you may face problems. The 'show if mounted' box is useful here, and even if the device or share is mounted or unmounted by other means, the current status is always reflected by the gkrellm file system builtin.
The mail builtin allows you to check local and remote mail, and to launch mail reader and mail check applications. Personally, I am more than satisfied with the abilities of thunderbird and evolution to handle my mail, but if you want something different, then this may be worth checking out.
If you use a laptop, then the Battery builtin is for you. It can display percentage charge, time remaining, time to charge and charge status. You also have the option to set alerts, or to run a command of your choice when you click on the meter.
The Uptime builtin displays the time since last reboot, enables you to launch a command when you click on the meter and to display a tool tip which you enter into the comment box.
The section after builtins is Plugins, and if you didn't install any, then this section will be empty. But there are quite a few of them available in the PCLinuxOS repository. Search for gkrellm. They cover additional functionality and range over a host of different subjects, some of them being of more use than others. I don't have a use for a sun or moon clock, but the weather plugin is particularly good, giving basic info, changeable by right clicking the meter, or a full report if you hover the mouse pointer for a second or two.
There are enough options to cover all bases, music control with xmms, screen shots, timers, stock tickers, and even a SETI@home progress checker. Use as little or as much as you like.
After the plugins section comes themes, and if you installed the themes package from the repository, then you may well be spoiled for choice. No further explanation is required.
Finally, there is the gkrellm-server package. Installing this will start a daemon running, which can be used by a remote version of gkrellm to monitor conditions on the daemon-running machine. If you have a main computer which you leave running for long periods and use it to remotely access resources, perhaps as a file or printer server or for media streaming, then installing gkrellm-server onto that computer allows you to remotely see what is happening very easily. Suppose that the server computer has a hostname of home_server and is connected to the network with an IP address of 192.168.1.2. To remotely monitor the server, run a terminal command like this:
gkrellm -s home_server
or
gkrellm -s 192.168.1.2
You can create a desktop shortcut to execute this if you don't want to open a terminal. The instance of gkrellm that appears will show information about the remote server.
There are some limitations. File system mounting is not supported, and not all plugins are client-server enabled. But overall, this is still a very worthwhile tool. What you display and how you choose to display it is your choice — and you certainly have plenty of that!
