
| Previous
Page |
PCLinuxOS
Magazine |
PCLinuxOS |
Article List |
Disclaimer |
Next Page |
LibreOffice: Calc Shortcuts |
|
by Meemaw I get emails from many sources in my job. I recently got one from one of the office supply companies I purchase from, telling me all the wonderful shortcuts that MS Excel has to simplify your work. After reading it, I decided to check LibreOffice Calc and see which ones work there, since I use Calc instead of Excel at work. Shortcuts to Navigate More Smoothly What follows are a few keyboard shortcuts you can use to move around your spreadsheet a little faster. Move to the last cell in a worksheet Sometimes you need to jump to the last records of data quickly. To do this, use <CTRL> + End (if your End key is on your keypad, as it is on my laptop, be sure to turn off your number lock.) Move from sheet to sheet Move to the next worksheet by pressing <CTRL> + Page down. Move to the previous sheet with <CTRL> + Page Up (again, if those keys are on your keypad, be sure to turn off your number lock). Move to the edge of a range of data If you have a large range of data, you can quickly move to the right, left, top, or bottom by pressing the <CTRL> + arrow key of the direction you want to go. I tried this with my Christmas card addresses, and I should warn you about any empty cells that you may have. I have some addresses that I took out because the people had moved and I didn't have new addresses yet. When I clicked <CTRL> + down arrow in the address column, the cursor went down to the last filled cell in that column, but when I chose the name column, which is all complete, the <CTRL> + down arrow succeeded in going clear to the bottom. Cutting Data Entry Time Data entry is time consuming no matter what spreadsheet or program you use, so let's look at some shortcuts that work in LibreOffice. Quickly Copy a Formula At work, I have a spreadsheet created for my payroll records. In a spreadsheet, anything you need to calculate must have a formula, or you do it yourself and enter the answer. So here, it is Hours Worked times Hourly Wage for one calculation, Calculate Social Security Withheld for another, Sum the Deductions and Subtract Deductions from the Gross Pay for two more! The pay period is twice a month, so for a year there are twenty-four pay periods, and four times twenty-four formula entries. Whew! Let's see if we can do it faster. Put your formula into the first row. In my example, I have entered the formula for calculating Social Security deductions (total wages multiplied by .0765). Instead of copying and pasting this all the way down, you can click the cell with the formula, which in this sheet is cell H2. Now hold you mouse over the bottom right corner until the cursor turns into a plus sign. Click and drag your mouse pointer down the rows you want the formula in. This will repeat and adjust the formula for each cell in the column. If you have data entered, it will calculate it as well. 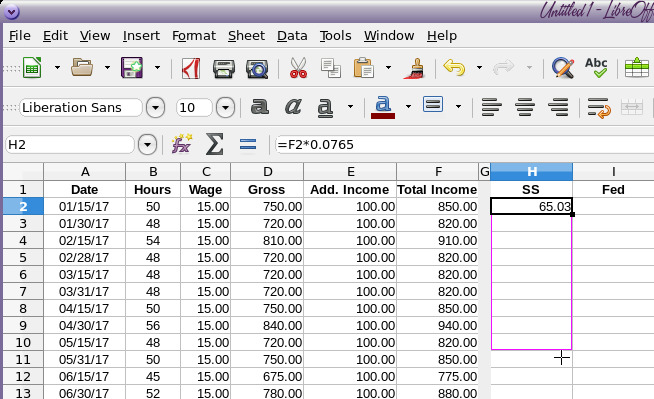 Freeze Cells When you have many columns and rows of data, it can be difficult to remember what each column is once you scroll down. If you have several data columns that have similar data (like records of month-to-month sales for many people, or sales of individual items), you run the risk of entering the data incorrectly. Rather than lose visibility of column headings or row names while scrolling, you can Freeze the Cells. To do this, place the cursor below the column heading and to the right of the names. That would be cell B2. Go to View and then Freeze Cells and then you have three choices: Freeze Rows and Columns, Freeze First Row or Freeze First Column. Do whichever works best for the data you have. 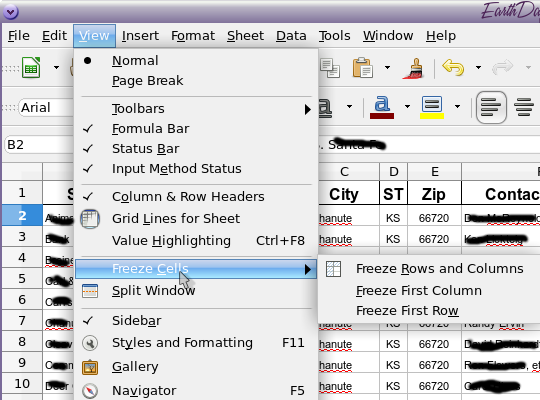 This will make the row and/or column headings stationary so you can see them while you enter your data. How to Make Projections If you have a data group, you might want to try to predict future values. For example, I might have a spreadsheet of employee sales over a 12-month period. It would be helpful to find a trend to see what the future might be. This can be done with a function called FORECAST. Using a spreadsheet of employee sales, I might be able to see the trend of sales over the next few months. 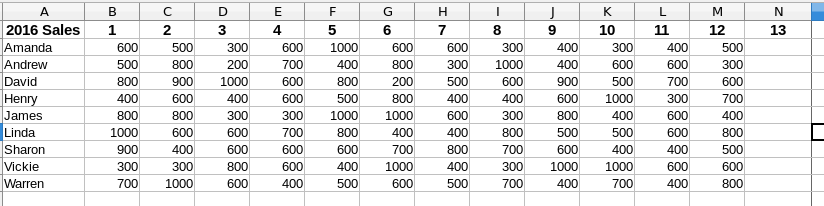
I have nine employees and period-by-period sames for 12 months. Let's say I need to try to determine how much inventory I might need for future months by looking at past months' sales. One way to do this is to use the FORECAST function, which will look at the trend of the sales and extrapolate into future numbers. We'll use Amanda's sales, so go to cell N2 and enter in the following formula:
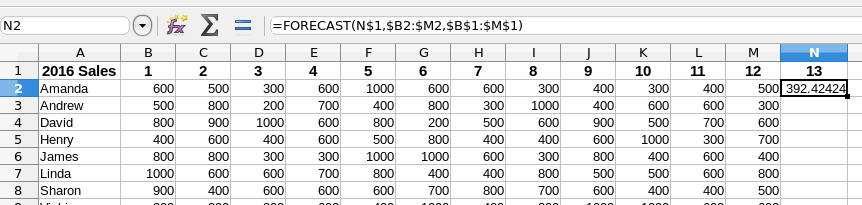 To break down this formula, you need three key components. The first part is the current period we are in, which is cell N1. This is period 13. For this formula to work, you need to have the period numbers like they are in row 1. By putting a dollar sign in front of the 1, Calc will always refer to row 1. The second part is the range of cells that Calc needs to find the trend for. In this case, the range is cells B2 to M2. You need to put a dollar sign in front of the B to anchor it, so when you copy it across, the first column is always B. The third part of the formula is the range of the periods to look at: cells B1 to M1. Both the second and third parts need to span the same columns. For this, we need to put a dollar sign in front of the B to make it stay there and in front of both 1s (so it's always looking at row 1). Once you do this, you can do a quick copy to copy it down the rows and over to the right for period 14 and 15, just like we copied the formula earlier. This will produce a projection of future sales over the next 3 periods. 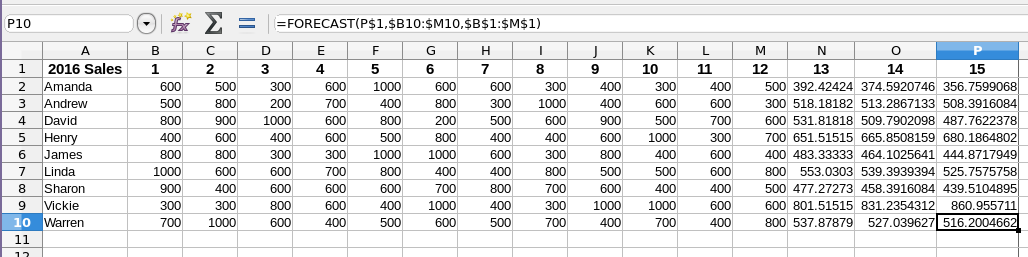 Pivot Tables If you have loads of data and it's hard to sift through it all, you might use a Pivot Table. A Pivot Table summarizes a large table of data into a smaller one to see the totals. Let's first look at our table: 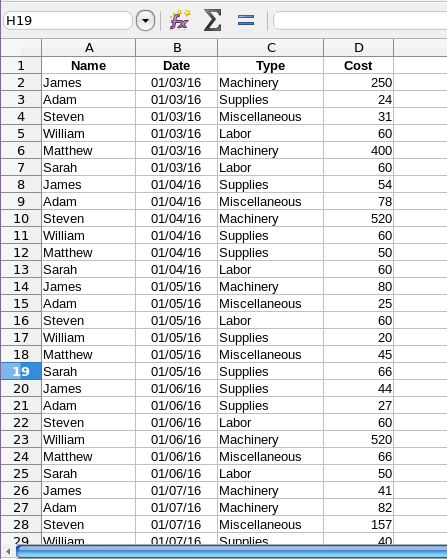 This is a table of purchases by employees and their categories and costs. A Pivot Table allows you to summarize it. To create a Pivot Table, place the cursor anywhere on the table where you'd like to summarize. Then click Insert and then Pivot Table. 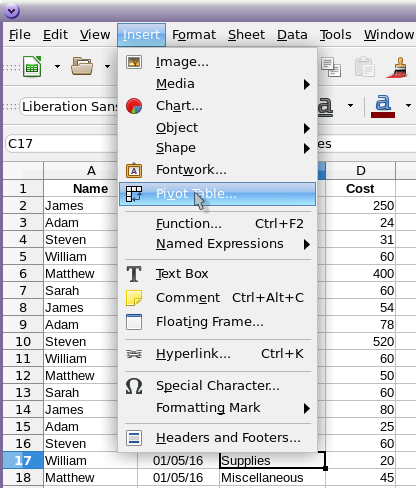 You will get a small window asking if you want the range chosen by Calc (which is probably all of your data), or if you want to specify a different range, or even select a different source (other than the spreadsheet you have open). I chose Current Selection. 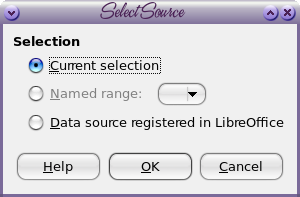 The Pivot Table window will appear. Up at the top, you are given your fields and you should drag them to the appropriate box to display your summary. What I want to do is see the totals spent for the four categories Machinery, Supplies, Labor and Miscellaneous. To do that, I will drag the field named "Type" to the Row Fields box so the types will be in my table, one to a row. Then I will drag the field named "Cost" to my Data Fields box. It should show up with the word Sum as well. You need to expand the Options and Source and Destination sections at the bottom. You have several options, but I just want the sum of each type, so I will choose "Total Rows". Also, the range of the table should be filled in. If not, fill it in manually. Then you can choose to display your data on a New Sheet or in a Selection on the same sheet. If you choose Selection, you can shrink the window and highlight the selection where you want the data to appear. I chose New Sheet. 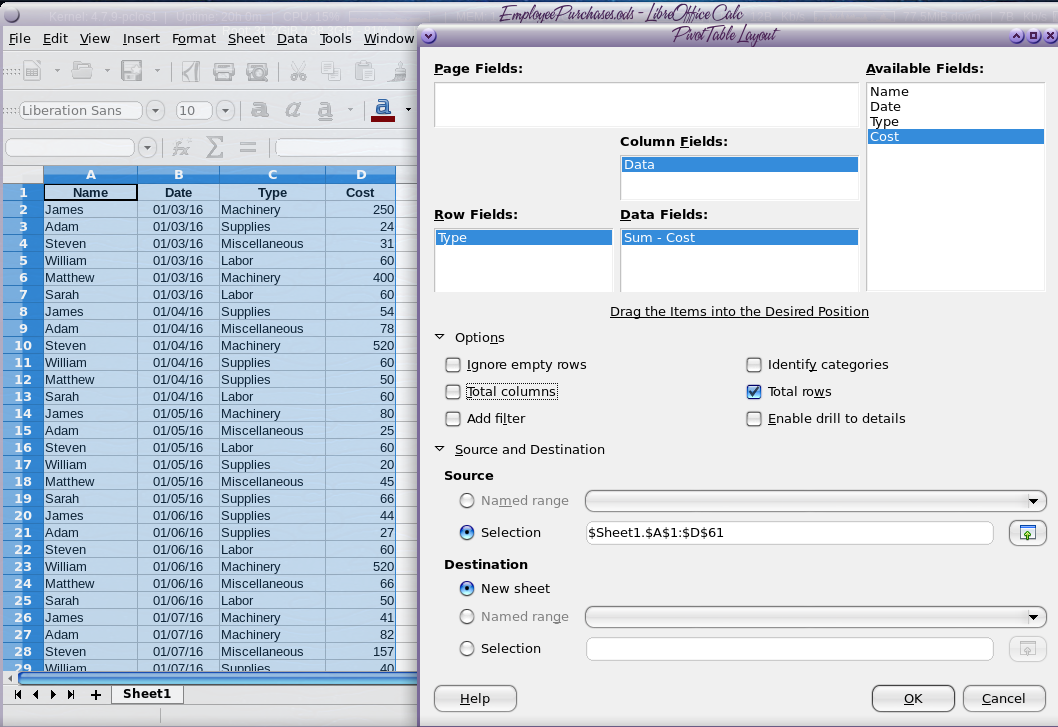 When you get your configuration filled in (depending on what you want), and click OK, you will be taken to your new sheet: 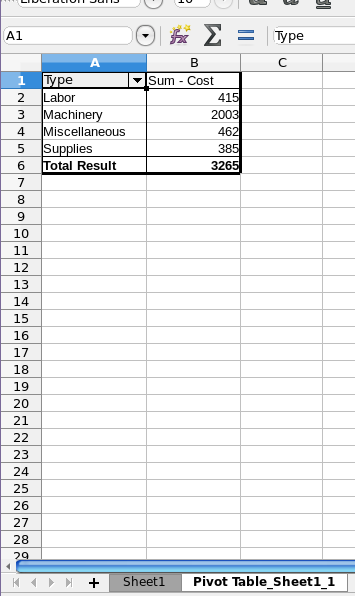 Now, if I want a summary of how much each person spent, I would drag the field "Name" to the Row Fields box and "Cost" to the Data Fields box. The result is a list of how much each person spent on another sheet. If you like, you can always copy everything over to the first sheet (or in your configuration window, you can choose range destination and select the cells on sheet one). 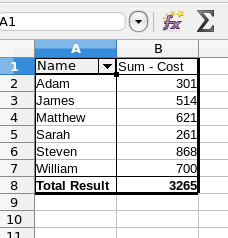 You can even see how much was purchased on a certain date by dragging Date to the Row Fields box. Depending on the fields that you have in your spreadsheet, you can summarize in many different ways. LO Calc is a great tool! The wonderful programmers for this office suite have labored long and hard to make sure it will do everything that the higher priced office suite will do, and they are doing an excellent job. One of the things they have done is to make sure that LO Calc is "keyboard compatible" with Excel, which is smart when you consider the market penetration of Excel and the rest of the Microsoft Office suite. This way, when users switch from using Excel to LO Calc, all the keyboard shortcuts that the user was accustomed to using in Excel also do the very same thing in LO Calc. It certainly does everything I need it to do. |